
#CryptoMarketRecovery
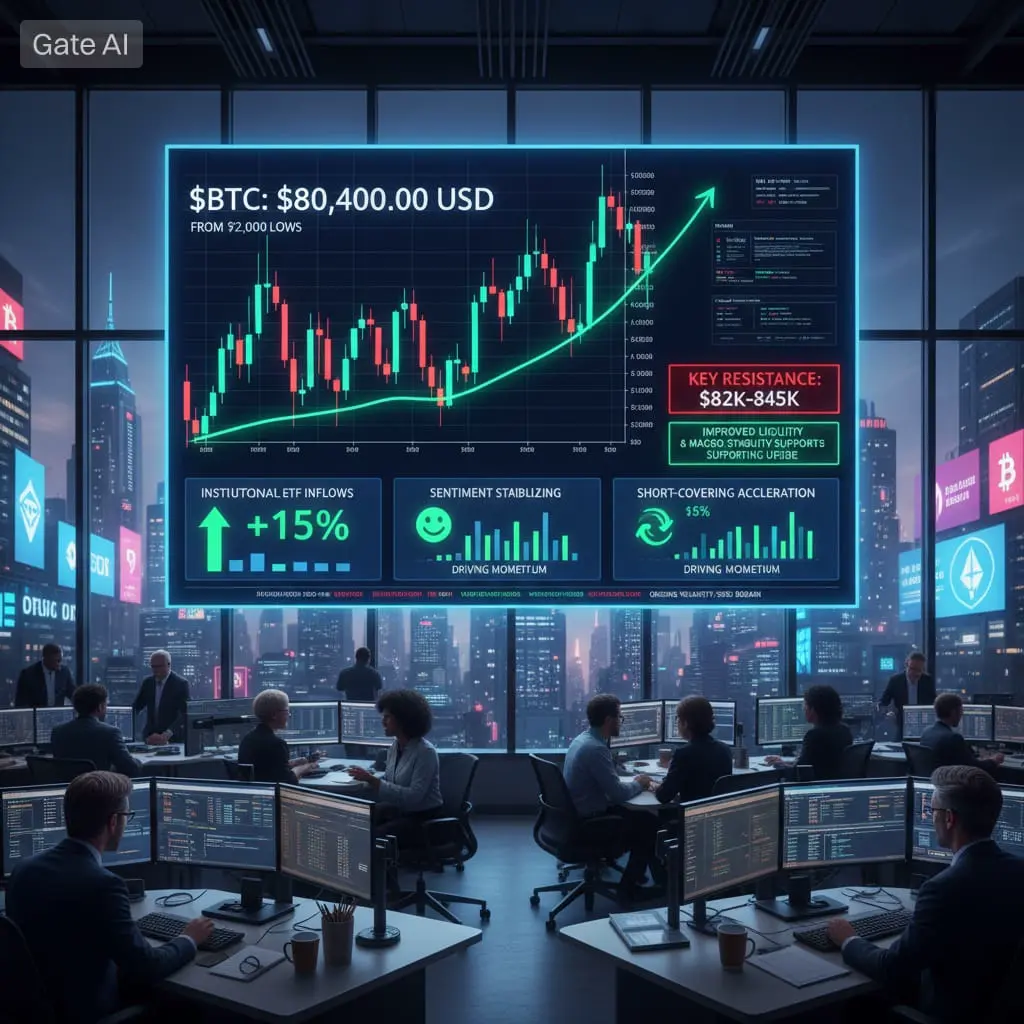
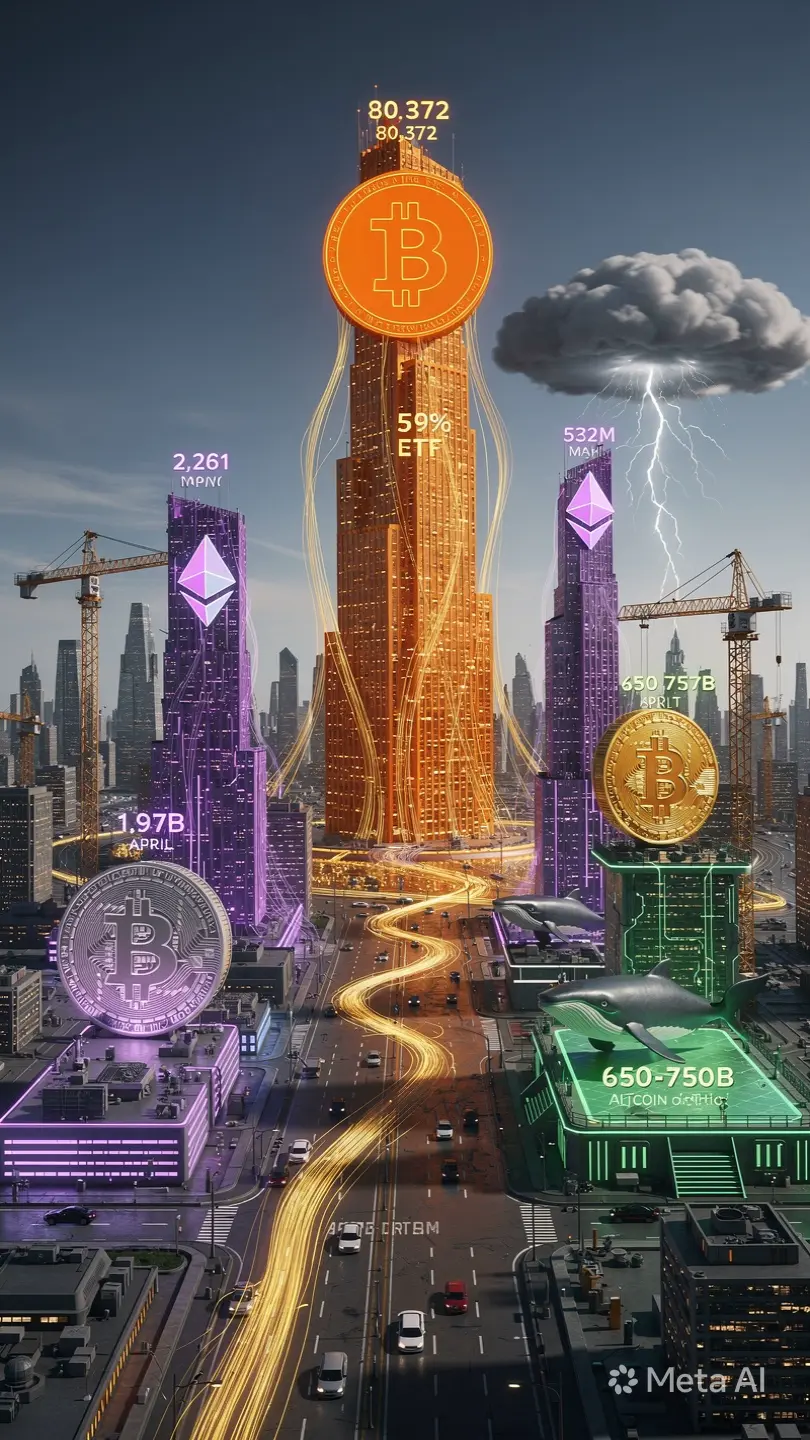
1. Total Crypto Market Value: 2.72 trillion USD 2. Bitcoin: 80372.18. 24 hour range: 79181.48 to 80500 3. Ethereum: 2261.81. Gas fees remain low near 0.47 Gwei, which shows quiet onchain activity 4. Bitcoin Share: 59.0 percent of total market value 5. Fear And Greed Index: 38, which reads as Fear 6. Total3 Value: Around 746 billion, holding the 650 to 750 billion support zone
What Is Driving The Recovery
1. ETF Flows Return: US spot Bitcoin ETFs recorded 1.97 billion in net inflows during April, the strongest month of 2026. May started with broad inflows of about 532 million for Bitcoin funds and 61 million for Ethereum funds. Total crypto ETF assets now sit near 123.1 billion. 2. Institutional Buyers Active: Large holders added to positions in late April and early May. One firm added over 101,000 ETH last week, lifting its total to 5.18 million ETH, about 4.29 percent of supply. 3. Macro Calm: No policy rate meeting is set for May. That removes a major risk event. Strong labor data and solid tech earnings helped US equity indexes reach new highs, which gave a tailwind to risk assets. 4. Derivatives Reset: The prior drop from 126,000 in October to 60,000 in February cleared heavy leverage. Open interest is rebuilding on higher price levels, not on lows.
How The Market Looks Now
1. Bitcoin Season: With a 59 percent share, capital stays focused on Bitcoin. The Altcoin Season Index reads 24 to 30, which confirms money is not rotating to smaller coins yet. 2. Derivatives Lead Spot: Derivatives volume sits near 867 billion, far above spot volume of 158 billion. Price moves are driven more by positioning than by new cash buys. 3. Stablecoin Activity: Stablecoin volume fell 13.35 percent on the last pullback. That shows less active trading liquidity and a wait for a clear catalyst. 4. Fear Still Present: A Fear reading of 38 shows buyers are cautious. The market is rising, but without strong greed.
Key Levels To Watch
1. Bitcoin: Support sits at 70675. Resistance is near 75190 and then 81000. A monthly close above 76000 would mark three straight up months, which has not happened in a bear phase before. A break under 75000 would shift short term control to sellers. 2. Ethereum: Stuck under 2400 for three months. Low fees and lower DEX volume keep price heavy. A clear move above 2400 with higher volume would open 2800. Holds under 2200 keep the range in play. 3. Total3: Holding 650 to 720 billion keeps the long term trend firm. A break above 900 billion would show altcoins starting to move. A loss of 650 billion would delay recovery.
Points To Follow Now
1. ETF Flow Data: Daily net inflows or outflows guide short term direction. Strong inflows support price. Outflows above 200 million per day would be a warning. 2. Policy And Law: The CLARITY Act markup is set for May 21. Progress on clear rules could lift funds and large cap coins. Delays keep the market in wait mode. 3. Onchain Signals: Watch coins moving to cold storage versus trading venues. More outflows to cold storage show long term belief. More inflows show sell pressure building. 4. Macro Data: Jobs and price growth reports still move liquidity views. Strong data with no rate cut path can weigh on risk. Weak data with rate cut talk can help. 5. Liquidation Zones: Large long clusters sit under 78000. A fast dip there could run stops and then bounce. Large short clusters sit above 83000.
Outlook
The market is in recovery mode, led by Bitcoin and ETF buying. April added 12 percent to Bitcoin and brought the strongest ETF month of the year. May started with positive flows and a break back above 80000.
For a full bull phase, two things are needed:
1. Bitcoin holds above 76000 on a monthly close and keeps making higher lows. 2. Capital starts to move to Ethereum and quality altcoins, shown by a rising Total3 and a falling Bitcoin share.
Until then, the path is higher but still fragile. Risk control matters. Use limit orders, keep position size modest, and track verified data before acting on headlines.
Stay focused, follow flows, and manage risk during this recovery phase.
#GateSquareMayTradingShare
#Gate广场五月交易分享