$POPCAT Breakout in Play — Momentum Building for Continuation
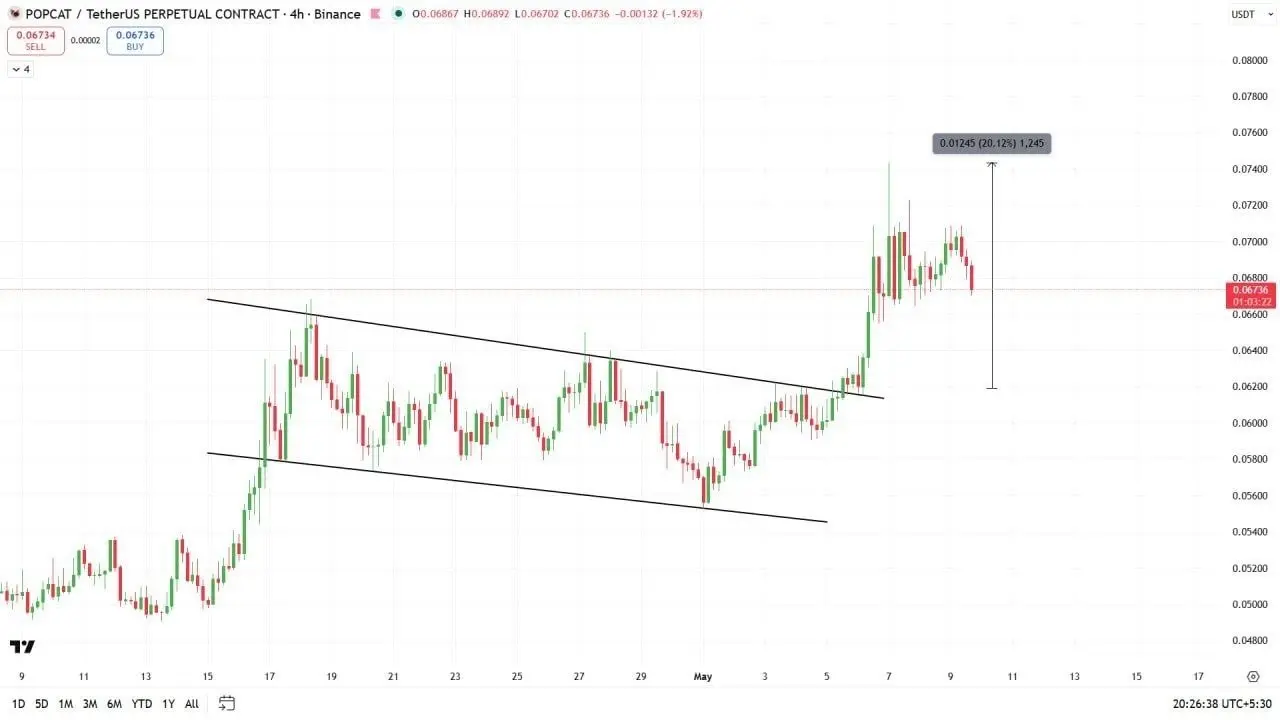
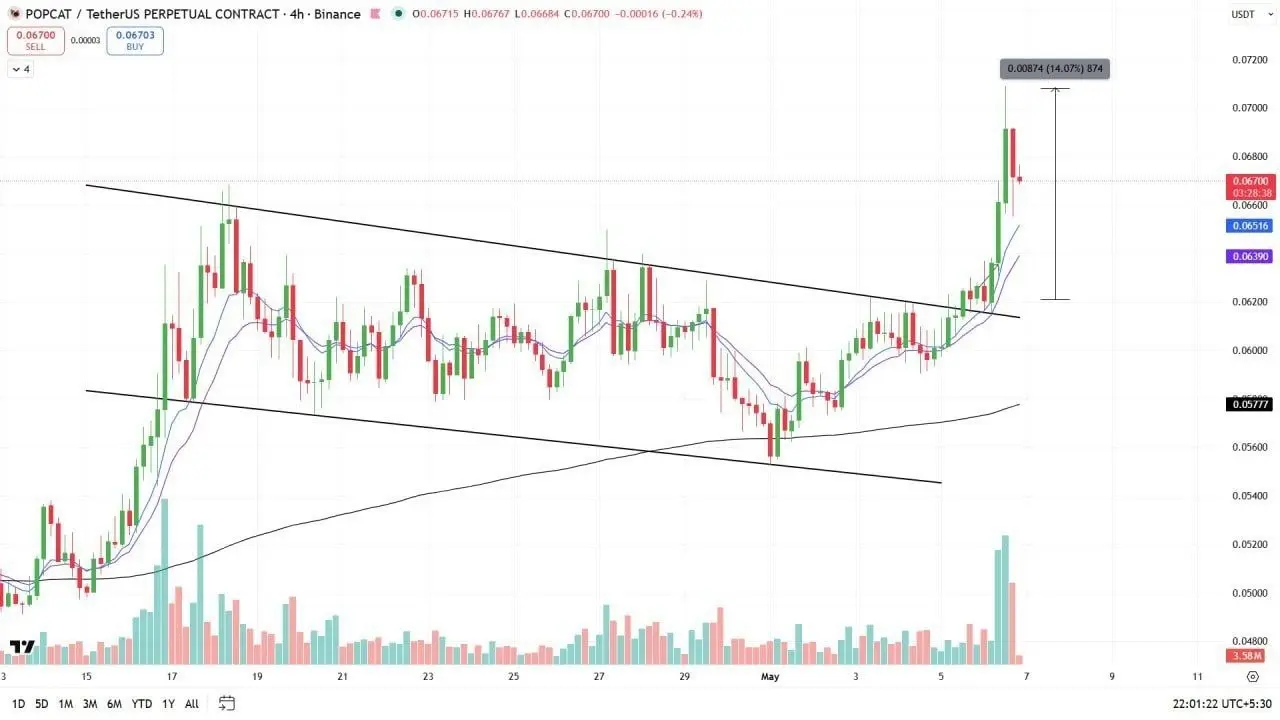
$POPCAT on the 4H timeframe is showing a clean technical shift from compression to expansion. Price has been respecting a descending channel for days, printing lower highs while maintaining relatively stable support — a classic accumulation structure before a move.
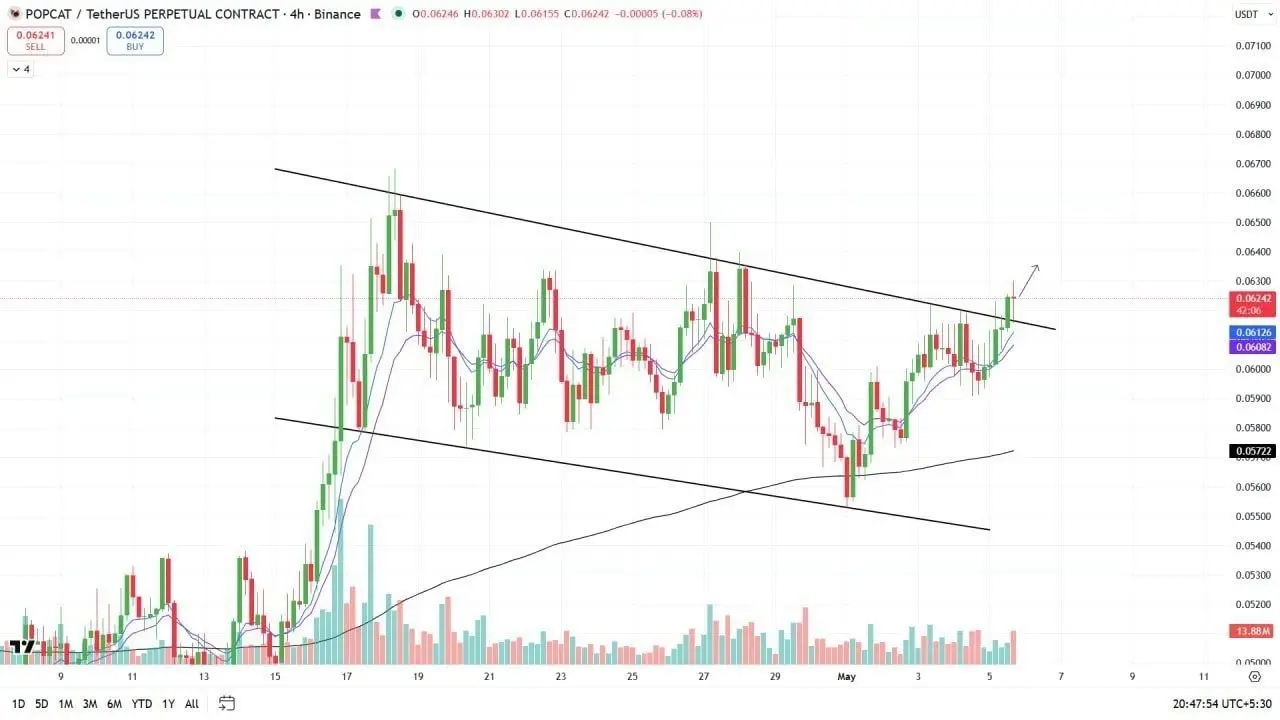
Now we’re seeing the key development: a decisive push into the upper trendline resistance zone around 0.062–0.063. Multiple attempts were previously rejected here, but this time momentum is different. The recent candles are stronger, with higher lows forming beneath resistance, and short-term moving averages curling upward — signaling growing bullish pressure.
Volume is also gradually increasing, which supports the breakout narrative rather than a fakeout. The reclaim of the mid-range structure and the bounce from the 0.057 demand zone adds confluence to the bullish case.
If price confirms a clean breakout and holds above the trendline, the next likely move is a continuation toward the 0.065–0.068 region. That’s the next liquidity zone where prior rejections occurred.
However, the key condition here is acceptance above resistance. A rejection from this level could send price back into the channel, with 0.060 acting as immediate support and 0.057 as the critical invalidation zone.
Right now, this is shaping into a breakout retest setup — the kind smart money watches closely. If bulls maintain control, this could turn into a strong trend leg rather than just a short-term spike.
#BitcoinHoldsFirmAbove80K